← projects
DoorDash Experimentation · The Platform

12,000 experiments across 42 million monthly users.

The experimentation team owns everything in the dashed frame. I led the Scorecard and Conclude projects inside it.

doordash products the experimentation platform exposure events · async request value · sync control or treatment publish config exposures · metrics · batch analysis config results Dynamic Values SDKs embedded in every app iOS · Android · Web + backend services Flags & Assignment dynamic values svc Snowflake the warehouse Dash-AB python stats engine Web App configure · analyze CRUD Service bff · grpc apis Postgres configs · results
← projects
The Before · Experiment Results

Eleven+ columns, no recommendation.
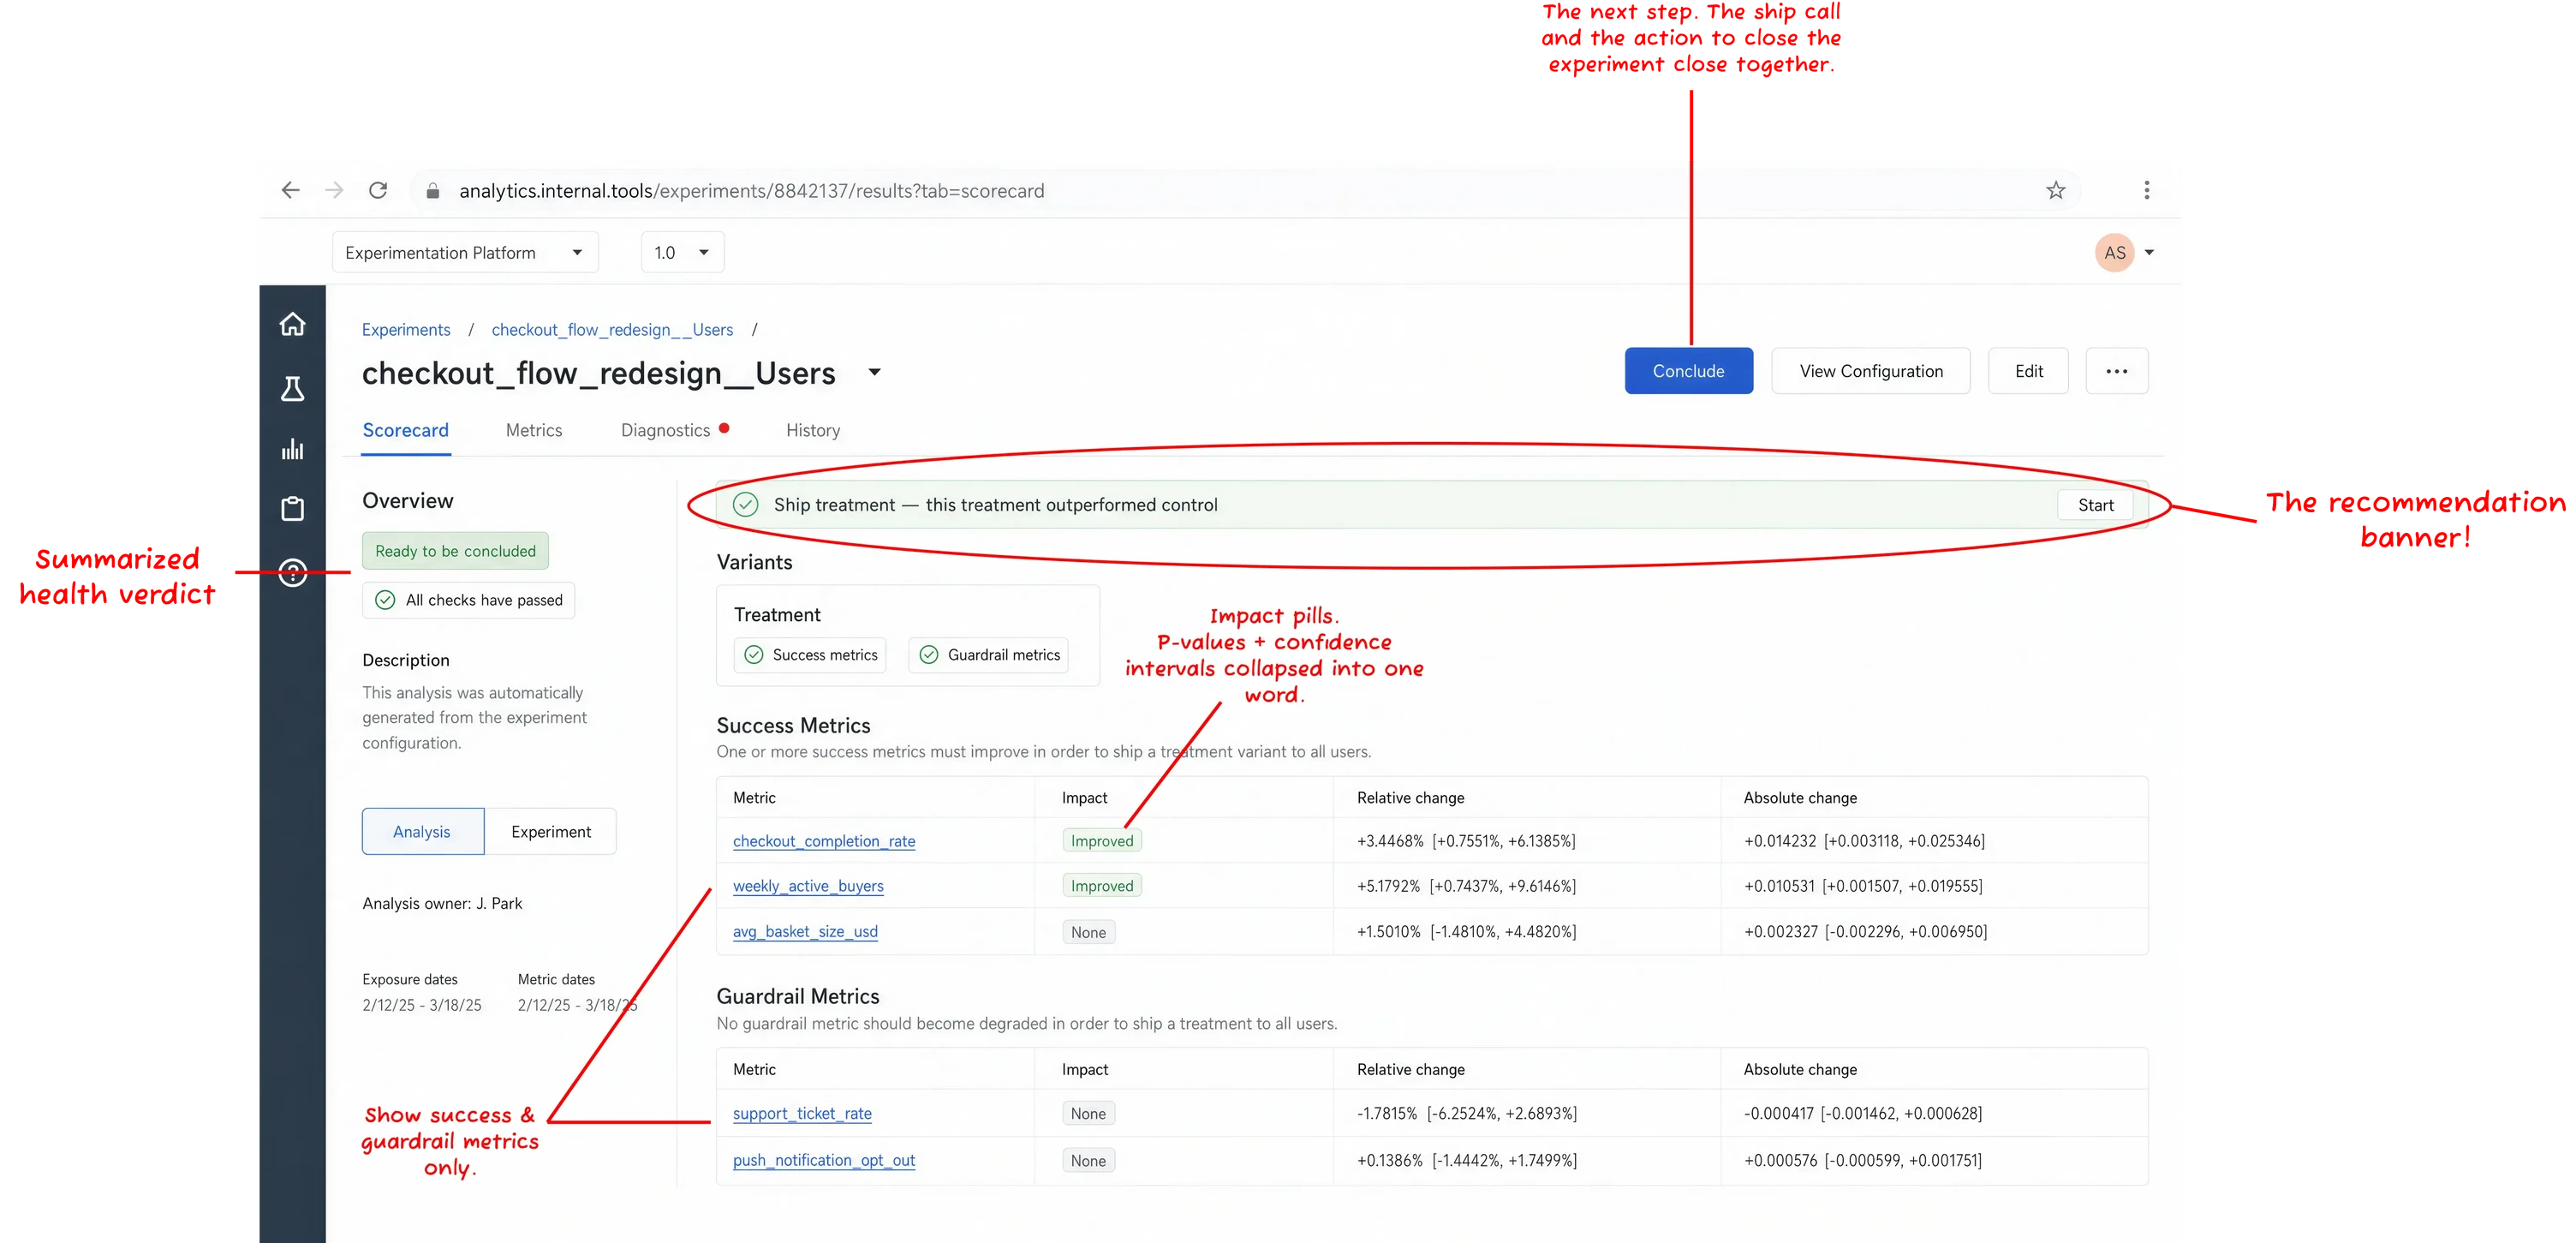
experimentation platform · internal The experimentation platform's dense metrics table: rows of statistics with no summary or recommendation
fig. i · the metrics view · gpt image 2 mock

what the table couldn't say

  1. 01

    a wall of numbers

    Readers face eleven+ columns of statistics and still have to make the ship call themselves.

  2. 02

    one view, four audiences

    The detail suits data analysts. Engineers, product managers, and S&O kept asking where their experiment stood.

  3. 03

    health checks need context

    The platform flags exposure and imbalance issues. Non-analysts struggled to judge which ones could change the decision.

← projects
The Toll · Experiment Conclusion

Each readout, written by hand.
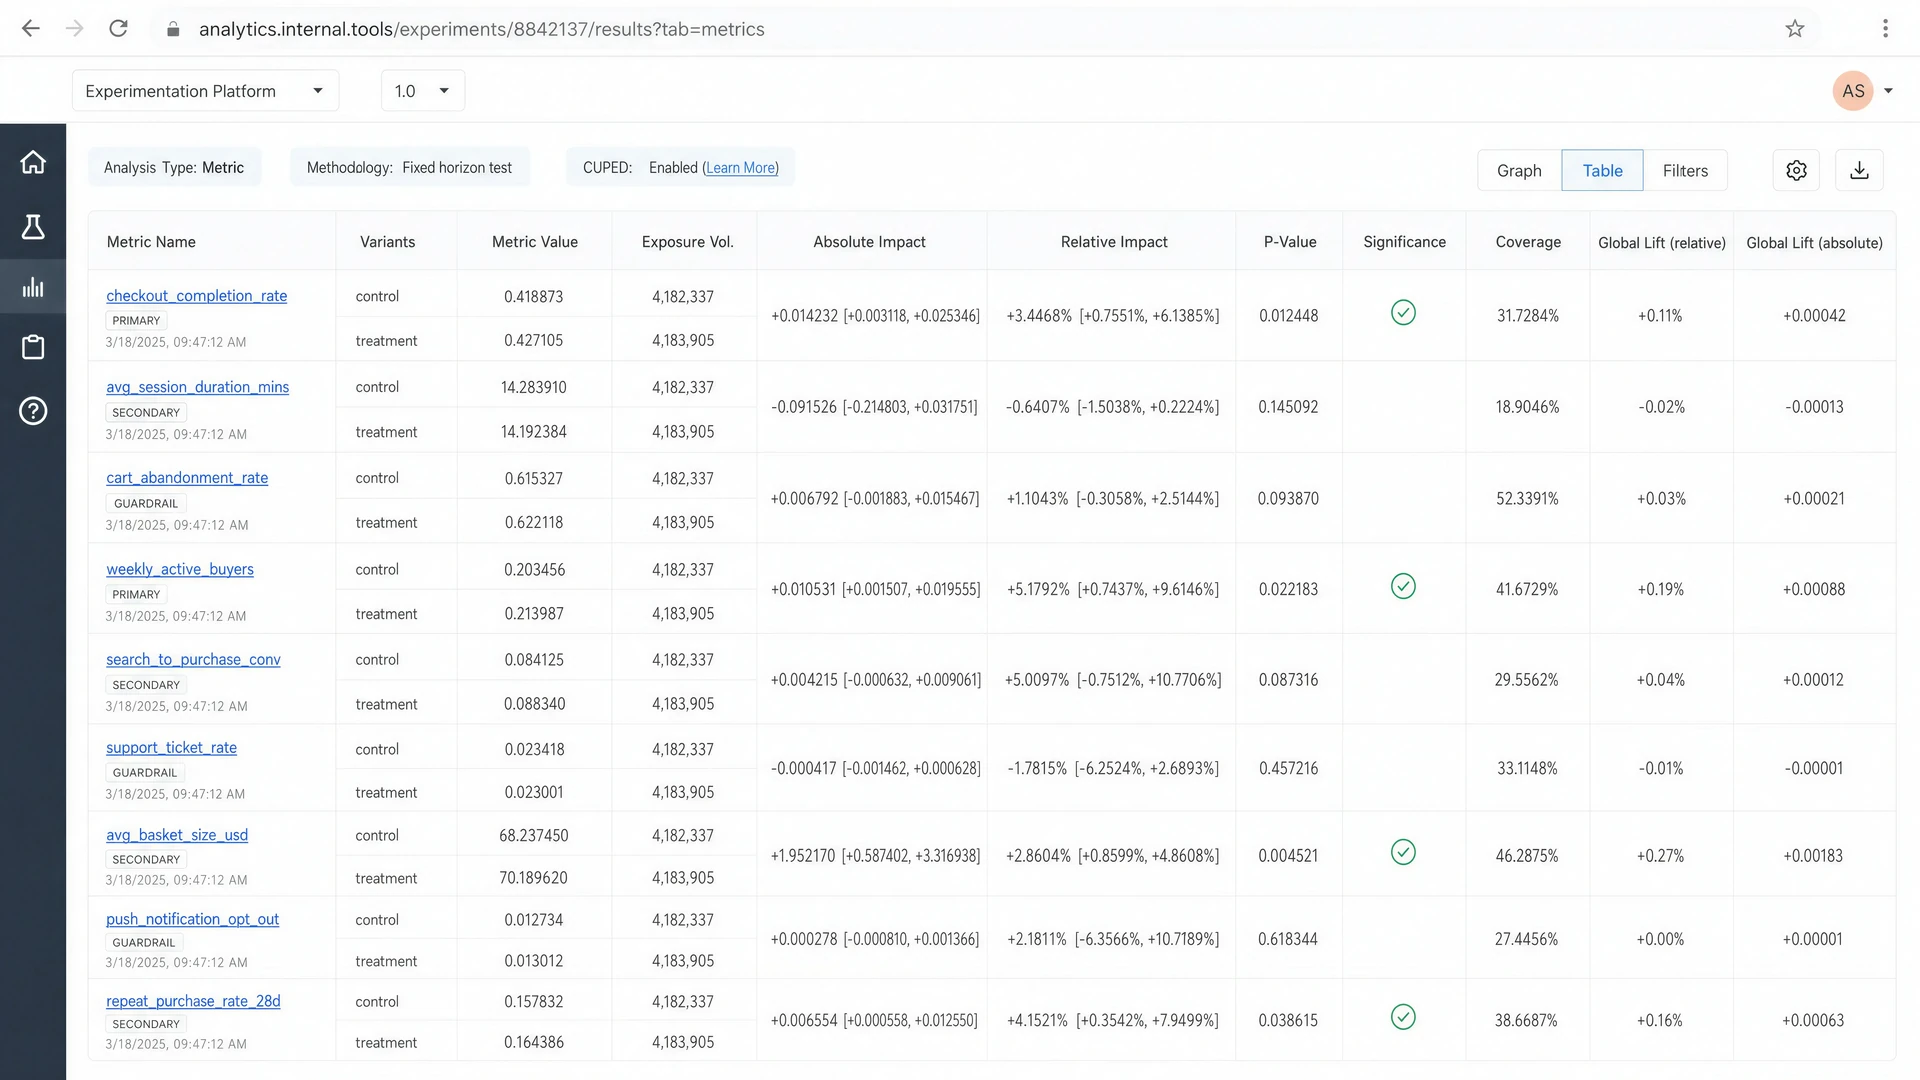
experiment readout · internal doc A hand-written experiment readout document: TL;DR, hypothesis, a small pasted results table, a ship decision with a red TODO, and an unresolved margin comment asking to re-check the math
fig. ii · the readout doc · gpt image 2 mock

what concluding took

  1. 01

    the hand-written readout

    Owners re-typed dashboard results into a doc for each concluded experiment.

  2. 02

    shipped elsewhere

    Engineers rolled out the winning variant from their own app. The platform stored no record of the winner.

  3. 03

    the toll

    One owner reported it took them four hours to conclude a large experiment.

← projects

The Solution

I proposed two projects.

Scorecard gives teams an answer. Conclude guides the next steps.

Part 01 · Scorecard

Scorecard

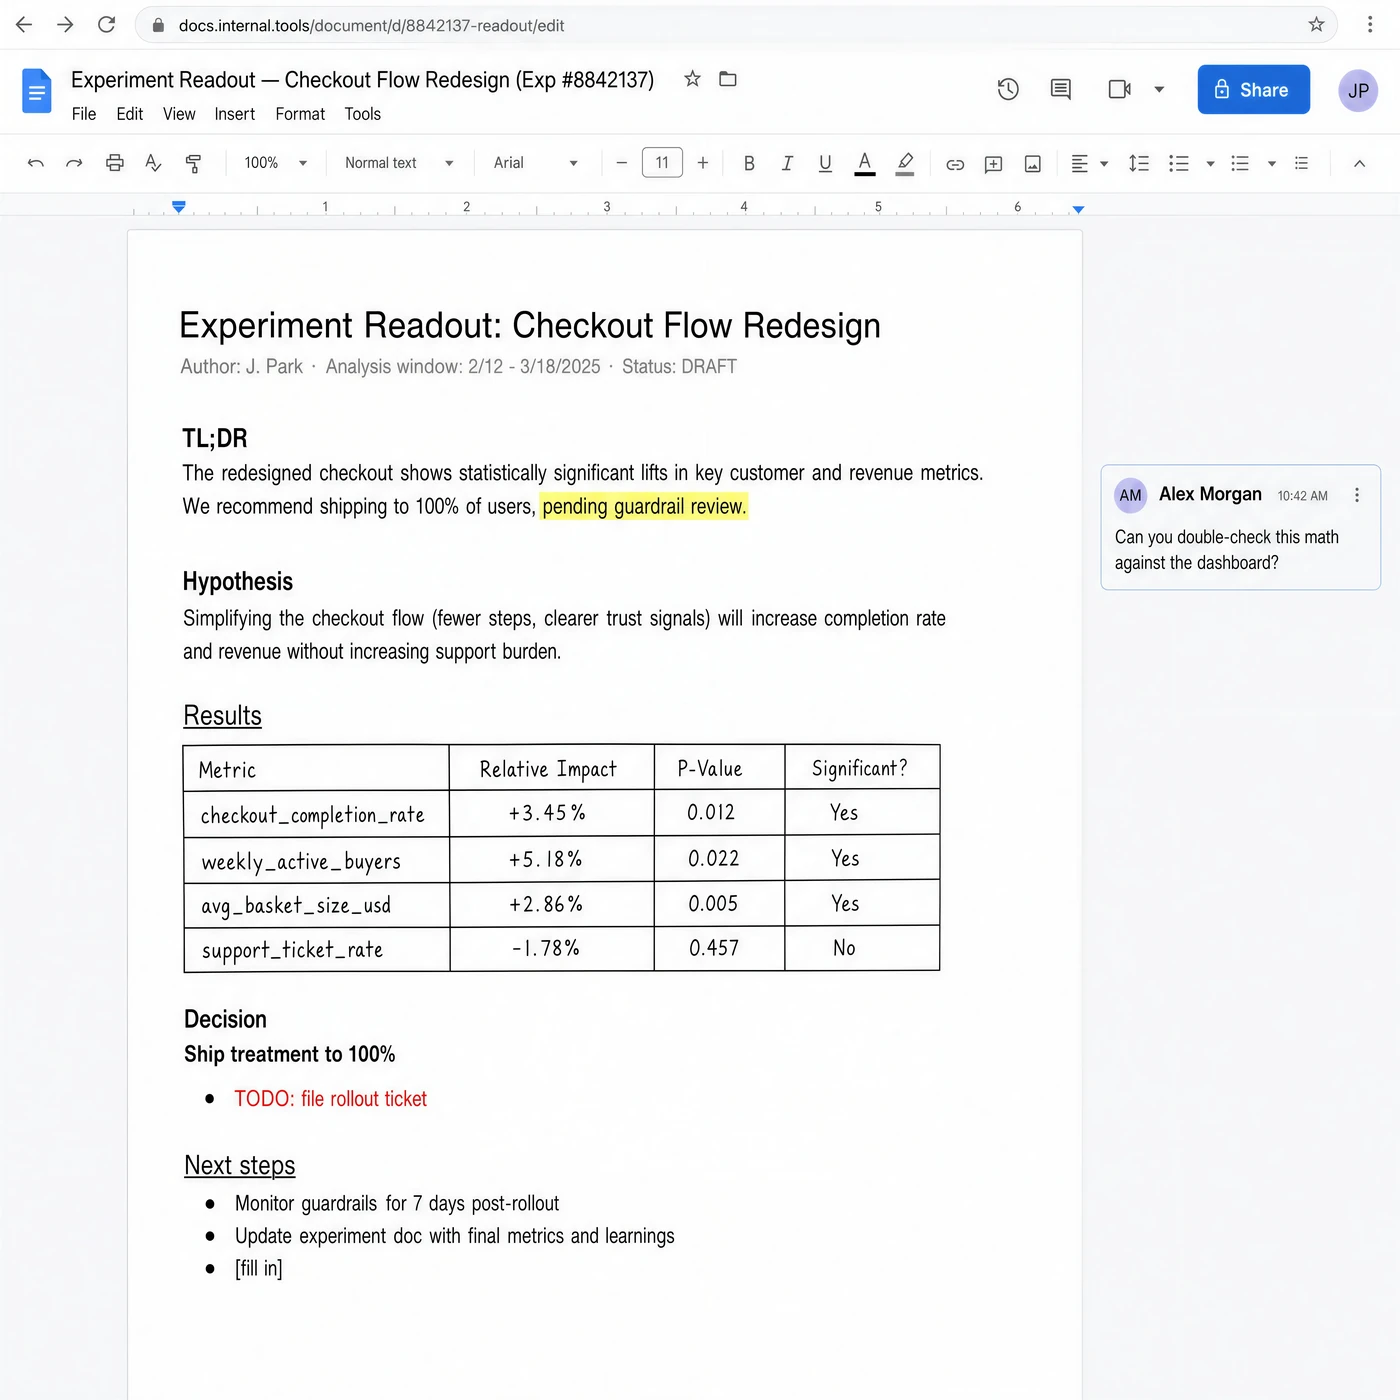
One consolidated results view that recommends an action.

  1. Overview, variants, and success + guardrail metrics in one place
  2. A recommendation up front: wait, ship, revert, review, or diagnose
  3. Health checks explained in plain language
Part 02 · Conclude Workflow

Conclude

A guided workflow to conclude an experiment.

  1. Six steps: variants, checks, guardrails, metrics, learnings, ship
  2. Every field pre-fills from the analysis, so nothing is re-typed
  3. The platform saves the final results and ships the winning variant
← projects
Goals & Team

Two goals, a team of four.

the goals
01

fewer status asks

Cut #ask-experimentation status asks by about a quarter.

02

conclude in minutes

Bring concluding an experiment from four hours down to minutes.

the team

Me

led the projects · front end · leadership syncs

Back-end engineer

conclude apis · data model

Data scientist · Product manager

decision rules · requirements

Stakeholders

analytics leadership · engineers & pms across orgs

← projects
The Scorecard

The same metrics, one recommendation.
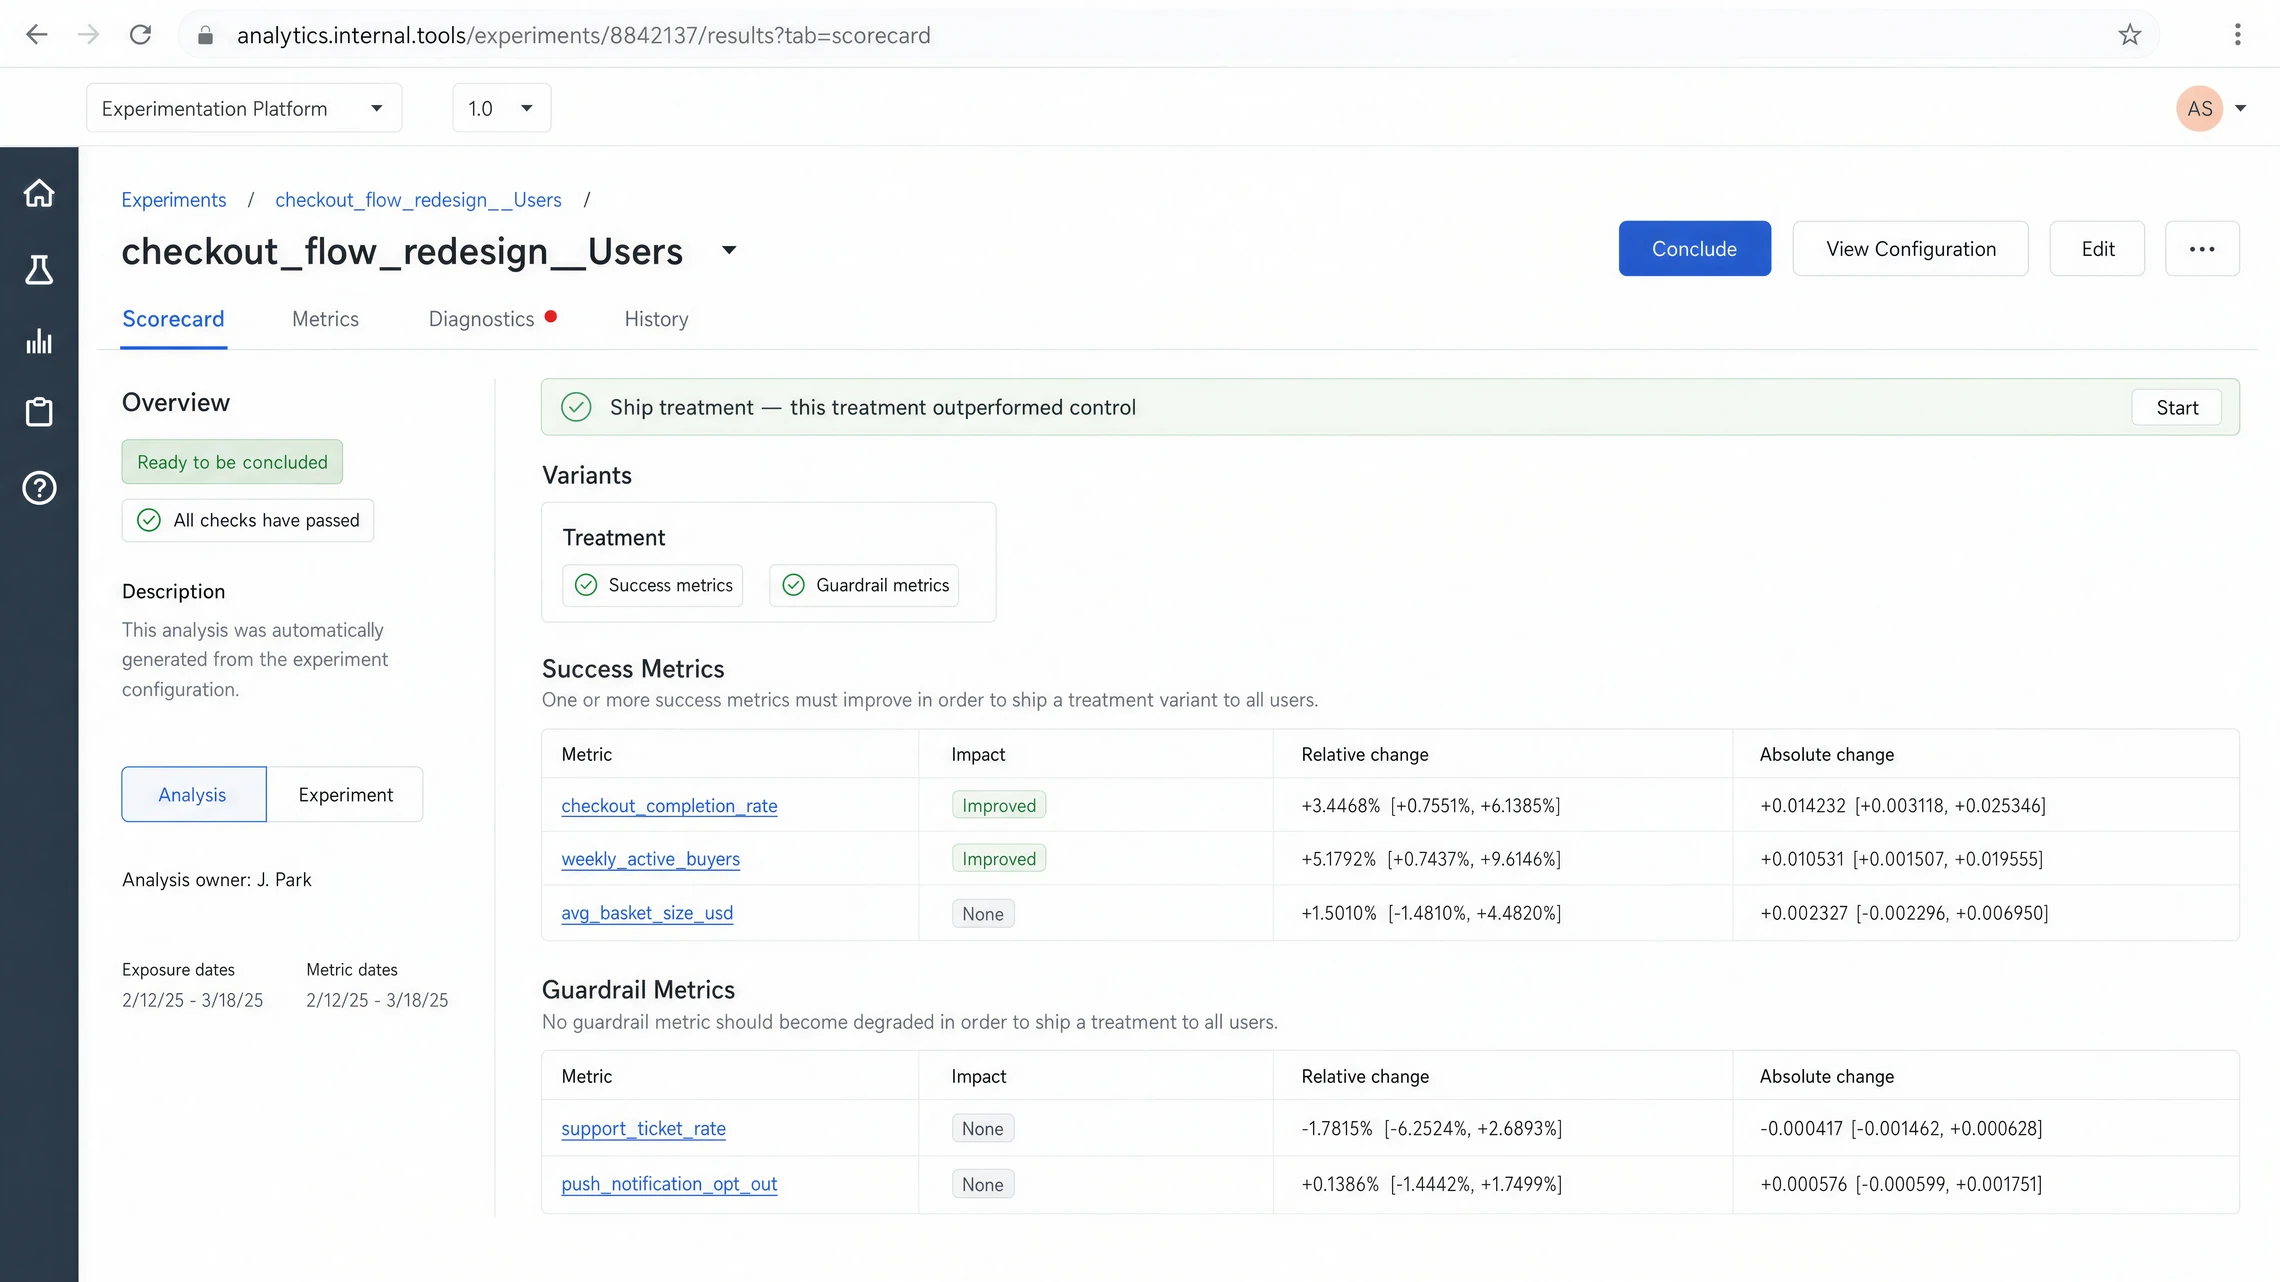
experimentation platform · scorecard The Scorecard view: a slim ship-treatment recommendation strip, a treatment variant tile with passing success and guardrail pills, and short success and guardrail metric tables
fig. iii · the scorecard · gpt image 2 mock
← projects
The Scorecard · Under the Hood

The full analysis, one recommendation.

~6 parallel queries cached + memoized backend apis GetHealthCheck mht guardrail check GetAnalysisResults primary + guardrail GetDimensionResults dimensional slices GetExperimentAnalysis report + conclude state front-end interpretation layer Significance p < 0.05 + direction check ? Per-variant status gains / losses / neutral ? Priority-ordered decision engine ? One recommendation per analysis Ship Revert Review Wait Diagnose
← projects The Scorecard view with annotations calling out the ship-treatment recommendation banner, the plain-word impact pills, and the health-check verdict pills
← projects
Conclude · A Guided Workflow

Six steps, ten minutes.

One flow handles the work spread across a doc, form, and spreadsheet.

step 01 Variants pick the winner
step 02 Checks health checks in plain language
step 03 Guardrails nothing degraded
step 04 Metrics confirm the metric movements
step 05 Learnings save learnings on the platform
step 06 Ship open a pr, route 100% traffic

Each step pre-fills from the analysis, including fields that owners used to copy into docs and forms.

← projects
Conclude · Under the Hood

Concluding freezes the analysis.

The boxes are database tables.

table · the experiment experiment_analysis id (pk) latest_analysis_report_id concluded_at ? table · one row per conclude analysis_report id (pk) analysis_result_version_id winning_variant · is_shipped table · the pin, ids only analysis_result_version id (pk) analysis_result_id analysis_metric_results_ids[] dimension_results_details_ids[] ? tables · raw results, frozen analysis_results id (pk) one row per analysis analysis_metric_results id (pk) per metric dimension_results_details id (pk) per slice

AddConcludeAnalysis · GetConcludeAnalysis · UpdateConcludeAnalysis

Each time an owner concludes, the platform writes a new version and points the experiment to it.

← projects
The Decisions · Tradeoffs

Three decisions, and the alternatives.

01

where the recommendation lives

ruled out

A new backend recommendation service. New API contract, a second deploy surface, slow iteration on decision rules.

chose

A front-end interpretation layer over the existing APIs. No contract changes, and the rules version with the UI.

02

freezing results

ruled out

A mutable concluded flag on the analysis row. Reruns would quietly rewrite history under a shipped decision.

chose

A new report row per conclude, and concluded_at on the analysis row. Setting that field stops reruns and config edits, so history cannot be rewritten.

03

pinning the numbers

ruled out

Deep-copying every result row into a snapshot table. Duplicated data to keep in sync, and slow writes on large analyses.

chose

A row that saves the ids of the results you were looking at. Nothing is copied, and reopening the report a year later shows the same numbers.

← projects
The Impact

How it went.

the goals
01

fewer status asks

~40% fewer

The goal was 25%. Teams found the experiment status in Scorecard before opening a thread.

02

conclude in minutes

10 minutes

Owners used six guided steps instead of a doc, form, and spreadsheet.

extra wins

Demoed at the analytics offsite

cited in the platform's h1 accomplishments

Base of the leadership dashboard

v2 is driving broader adoption

Business-impact math

exploring one shared formula next

← projects
What Didn't Go Well · Learnings

What went wrong, and what it taught me.

  1. One default I'd reverse: hard-blocking on any failed health check. A secondary metric pipeline issue blocked concluding, and some users went back to hand-written readouts. Warn first, and hard-block only on genuine bias.
  2. Analysts, data scientists, engineers, and PMs each needed a different read of the same screens. I aligned all four before the build, but badly underestimated how much of the schedule that would take. Coordination is project work, and it needs its own budget.